We are laser-focused on the business impacts of SEO tests. Rankings and clickthrough rates don’t pay the bills, so we focus on the actual people who find your site via organic search. We measure visitors, and in our full funnel tests, look at their on-site behaviour and conversion rates as well. You can learn more about why we do it this way here.
The only problem with this approach is that it bundles together all of the ways that a change could move the needle - it’s the right approach for assessing what the net impact of the change was, but it remains difficult to unpick afterwards why your change was a good one. Until now.
Why did this test win?
Integrating Google Search Console data is one of our most common feature requests (up there with Googlebot tracking) and I’m excited to show you what it looks like in practice. Our goal with this feature is to make it easier to explain test results.
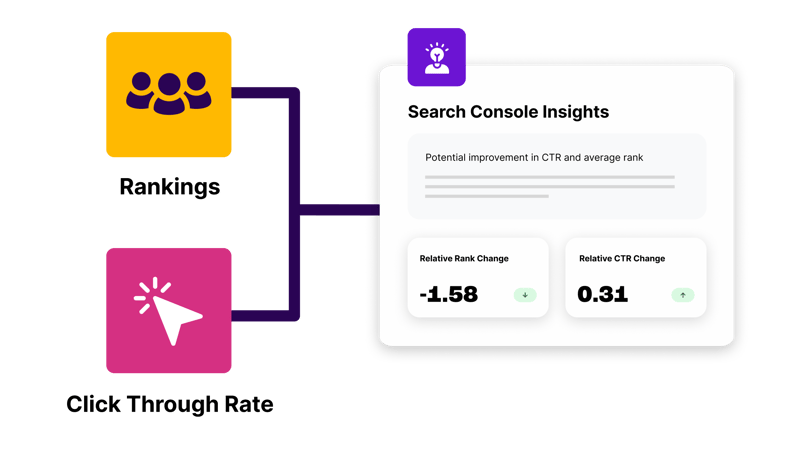
We show a new section on conclusive test result pages to help with this explanation and analysis:

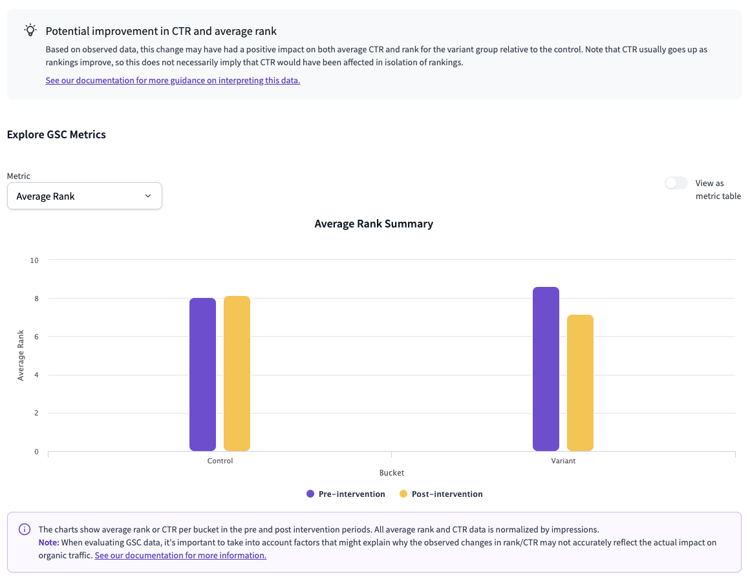
Where before, you were only able to take test results and communicate the confidence and magnitude of uplift (which is a huge win compared to the loose and subjective ways we used to have to communicate SEO results), now you are able to add on explanatory data showing, for example, that a winning test is primarily down to a clickthrough rate improvement with no measurable change to rankings.
In general, the way we think about it is that if a winning test shows a ranking improvement, in our “relative rank change” metric, that most likely explains improvements in clickthrough rate as well - or at least we are unlikely to be able to tease the causes apart further, since higher ranking positions typically get better clickthrough rates. If there is little change to average rank, but we do see an improvement in clickthrough rate, that is more likely to be due to more compelling snippets or more targeted rankings. (Failing to see explanatory movements is most likely due to limitations in the data, but may nudge you towards re-testing marginal tests or those without compelling hypotheses to explain them).
How does the SearchPilot platform show Search Console data in test analysis?
We have a new section of the test analysis view - below Googlebot crawl data - with the crucial information first - a summary of the relative movements of the two key Search Console metrics (rankings and clickthrough rate) when comparing the variant pages to the control pages before and after the test start date as you saw above. This comes with an explanation of the implications and some of the subtleties of what’s going on:

We know you’re all data-obsessed, though, so we also present all the data for both metrics in table form alongside the bar charts:

One of the crucial caveats that we always have to take care to consider when evaluating Search Console metrics is the coverage of the data. Unfortunately, whether due to GSC sampling or other factors, we never see data for all pages in the test - even ones we know got organic traffic. To help with evaluating the trustworthiness and usefulness of the average metrics above, we expose two crucial pieces of information for both the control and variant groups of pages:
- Path capture rate - the percentage of all URLs we know got organic traffic that show up in the Search Console API data
- Session capture rate - the percentage of all organic sessions to the testing site section that go to pages that appear in the Search Console API data
Path capture is easy to understand but can seem deceptive low if a lot of pages get very small amounts of long tail traffic. Session capture is better for judging the quality of the data. We commonly see path capture rates below 70% despite session capture rates in the 90-95+% range.
This is what that table looks like in practice:

If you’d rather see all this as a video walkthrough, we’ve got you covered:
Limits of Search Console data
Ranking and click through rate data can give us insights we can’t get any other way, but we still believe organic traffic (and, in full funnel tests, conversions) should be the main success metrics for SEO tests.
Limits to Search Console data stop rankings and click through rate being primary metrics:
- Average rankings and average clickthrough rates are funny metrics. Ranking well for a high volume search query can drive huge amounts of traffic at below average click through rates - just one way that the average can get worse even as overall performance improves.
- Gaining and losing very low rankings (or dropping far enough down to get zero impressions) can skew the average ranking without making any business difference at all.
- Other search engine result page (SERP) features are not captured - including ads - so clickthrough rate can change dramatically in ways unrelated to the test - even without ranking or search snippet changes.
- Sampling - even for huge websites with very large amounts of organic search visibility - is a real limit and not only a problem for small / new websites. We commonly see path capture rates below 50%.
- As a result of all of these factors, we may see skews between the control and variant groups of pages that prevent powerful test analyses.
It is possible to see confounding data, with these metrics appearing to move in the wrong direction compared to the overall test result, or to fail to see explanatory movements. This could easily be due to these limitations, but may also nudge you towards re-testing marginal tests or those without compelling hypotheses to explain them.
You can’t use Search Console data as your primary test result metric
Fundamentally, the only true measurement is the user-centric one of total visitors from organic - which you can approximate with weighted versions of Search Console metrics, but which we choose to measure and use directly.
We are excited to release Search Console data as an explanatory tool for understanding why a test result has turned out the way it has, but all our work in this area has made me even more convinced that if you are using this data as your primary success metric for SEO tests, you are going to find yourself wading through mud and coming up with the wrong answers far too often.
See it in action and start understanding your test results
If you would like to see a demo of the GSC integration in action, or discuss how to improve your SEO experimentation program, get in touch.


![[Webinar Replay] What digital retail marketers should DO about AI right now](https://www.searchpilot.com/hubfs/what-to-do-about-ai-thumbnail.png)