The accuracy and validity of our statistical analysis is critically important to the success of our customers’ experimentation programs. We often hear that our customers choose us because our analysis capabilities enable greater sensitivity: detecting more winners (and even smaller winners) with greater confidence than alternative approaches.
We also know that as the importance of the analysis increases, it becomes more and more important for our prospects and customers to understand how it works. In addition to the high-level business view of our analysis engine, we wanted to go into greater depth and detail.
This article assumes that you know how SEO testing works and the benefits of doing SEO differently in this way.
How the analysis differs to the analysis of user testing
There are two key differences between a split of users (as in conversion rate or UX testing) and a split of pages (as in SEO testing):
- Pages can show a greater range and variability compared to each other than the range and variability in user behaviour
- There typically aren’t as many pages to divide between control and variant as there would be users in a typical user test
This is somewhat mitigated by having more data about each page (because we get daily traffic data) than you would typically have about a single site visitor who might only visit once or twice in the test period.
What it does mean, though, is that it is less effective to compare control and variant performance directly because inherent differences or random fluctuations between groups might make it seem like there's an effect when it's just natural variation or the fluctuations might obscure real effects.
Instead, we build a forecast of the expected performance of the variant pages if they had been left alone. This is based on historical data from all pages, as well as the post-intervention data about the control pages’ performance. We are then able to compare this “counterfactual” forecast to the actual performance of the variant pages.
When you are reviewing the results of an SEO test, therefore, you are typically looking at actual vs. forecast performance of the pages you have changed in the test, rather than comparing control and variant performance directly.
The point of the control group
The performance of the control pages (which have remained unchanged) is used as training data for the model, and the post-intervention data showing the performance of these pages after the start of the test captures a range of potentially-confounding sources of external noise, including:
- Seasonality and other spikes in demand
- Google algorithm updates
- Competitor actions and activities
- Changes in brand performance or advertising activities
Because these external and / or random effects are equally distributed across control and variant groups, we can use the observed effect on the control group to update our counterfactual forecast for the variant group and isolate the effect of the change we have made.
The larger the group of pages in the test, the more organic traffic they receive, and the more predictable their performance, the better our forecast can be, and the smaller an uplift we are able to detect to a given level of confidence. As discussed below, the model can self-assess its confidence intervals.
A Neural Network approach
When we launched SearchPilot, we used the open source Causal Impact package, but as we announced in 2019, we moved to a neural network-based approach because it enabled us to double the sensitivity of our analysis.
A model that outputs its own confidence in its analysis
Today, we use a similar Bayesian approach to Causal Impact, but by training on a large number of random “shuffles” of the data, we build a more robust model that is less sensitive to noise or randomness coming from individual pages in the set. This approach also allows us to bootstrap a confidence interval, by observing to what extent any detected uplift persists under random shuffling of the pages. It was by improving this process that we improved the sensitivity of our model by a further 10-15% leading to a 16 percentage point increase in conclusive tests.
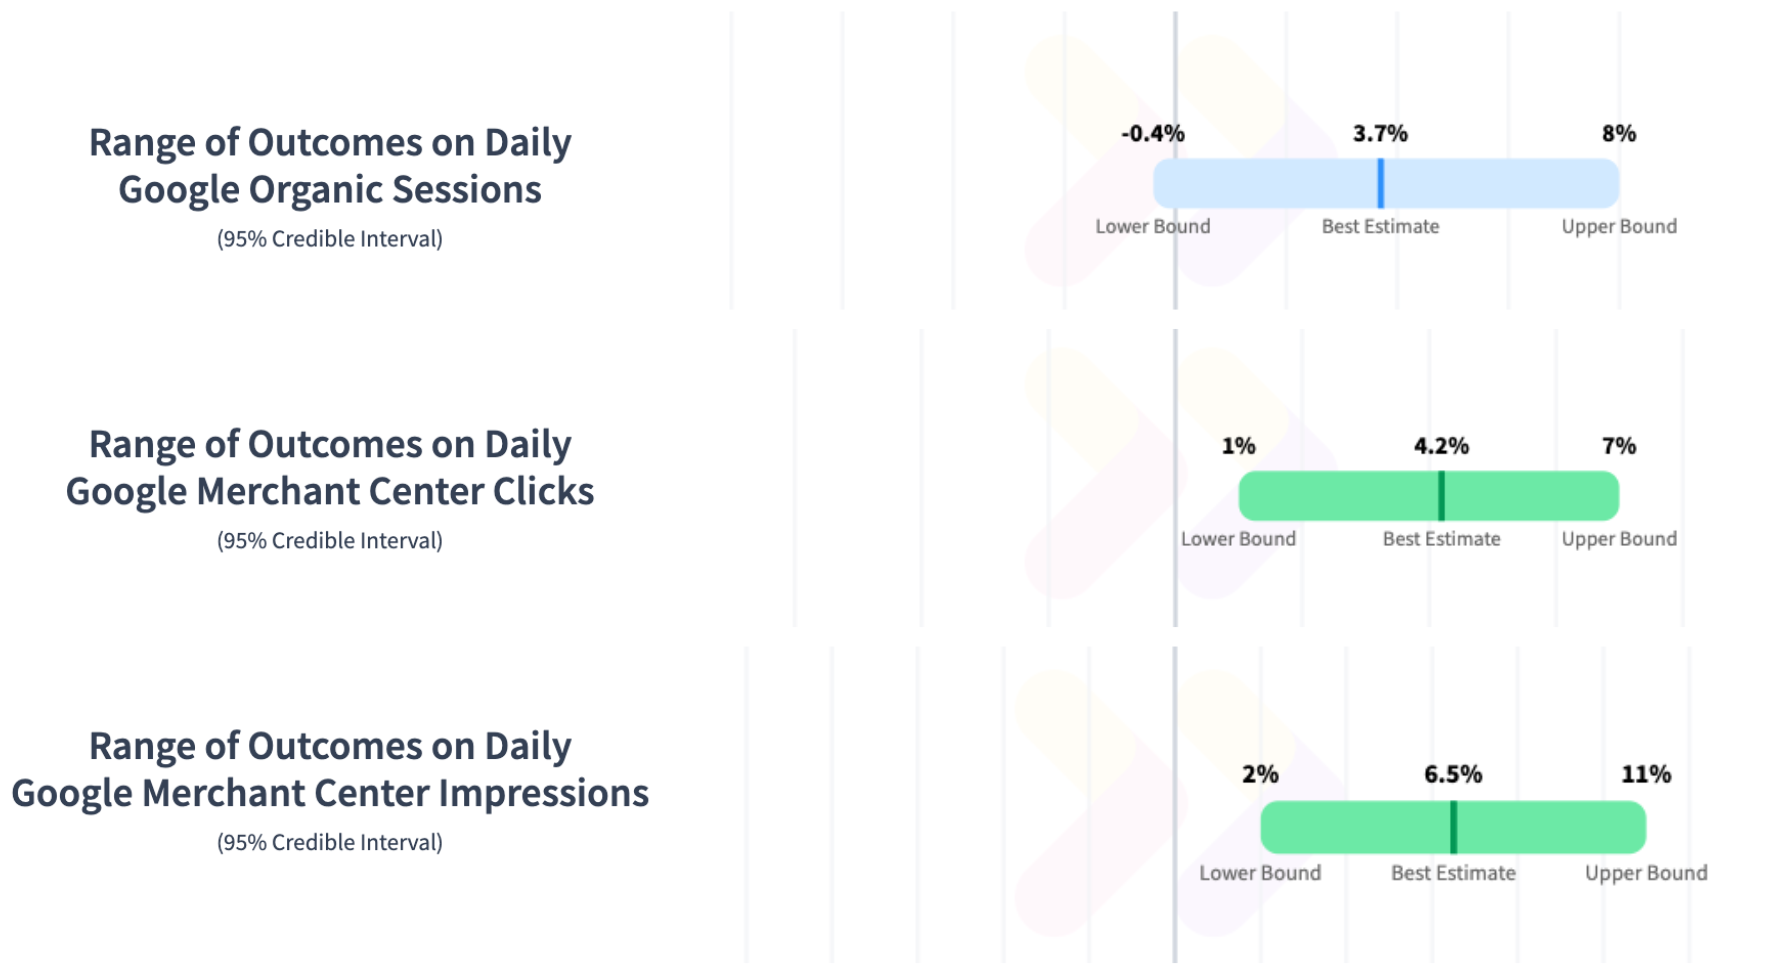
Having the model output its own confidence in the results enables better business decision-making and iterative testing. It's very powerful to know not only the best guess of the impact of a change but also to know the range of possible impacts with near certainty.
Building the best control and variant groups
One of the keys to an accurate forecast (and hence a sensitive model) is to create control and variant groups that are as similar as possible. We call the process of building good groups smart bucketing. Its objective is to create two groups of pages that are as statistically similar as possible by considering factors such as average traffic levels, variability of traffic, and seasonality. Sometimes, a particular test will have a predefined variant group (for example if we want to test the impact of a new batch of content that has been written for a set of pages). In these situations, we build what we call a “lookalike” control - which is the same process of seeking a statistically-similar group of pages, but applied to a fixed variant group rather than seeking a split of the whole site section.
Detecting outliers
Another key is the detection and removal of outliers. This is a complex area because an outlier is sometimes caused entirely by external factors e.g. a spike in demand, but can actually be the result of a test working. Our advanced outlier detection capabilities can remove certain outliers automatically, or report on potential outliers for experts on our professional services team to review using advanced tools like the long room.
Improving the accuracy of the model
Since the quality of the model is so important to our customers, we have invested significant R&D effort not only in improvements themselves, but in the tooling that enables us to make continuous improvements. We now have a historical database of probably more SEO tests than any other organisation in the world. Being able to run new models and ideas against historical tests data is extremely powerful. We have built a benchmarking framework that makes this easy, and that shows the performance of our model improvements.
We’ve already covered the improvements we saw when we moved from Causal Impact to the neural network-based approach, and that we saw when we improved the shuffling used to bootstrap confidence intervals. We are also innovating in our outlier detection capabilities, our ability to sub-divide site sections, and many more areas. Through our internal tooling our professional services team is able to run different models, use custom pipelines that include different manual and automated outlier removal, control the target confidence intervals and much more. You can read more about the capabilities of the long room here.
Explaining SEO test results
We believe that it’s important for SEO tests to generate results in metrics that are as close to business objectives as possible, and that means paying close attention to traffic and conversion data. In order to explain the results, however, we turn to ranking and clickthrough data from Search Console. Our research has shown that this data is not reliable enough to generate statistical confidence correctly on most SEO tests, but it can be a powerful complementary tool for understanding and explaining an observed impact.
If you'd like to know more, and learn about how you could improve the power of your SEO experimentation, get in touch.


