When you test a hypothesis using SEO A/B testing, it’s helpful to know what’s influencing the confidence interval of the result. One significant influence is whether or not Googlebot has re-crawled your variant pages since you launched the test. After all, if Google isn’t seeing and indexing the changes you’re making, it’s impossible to run an accurate test analysis.
Because SearchPilot deploys server-side, we get to see Googlebot requests. And we’ve built that data into the test dashboard so you can run better test analyses.
This article explores how SearchPilot’s integrated Googlebot crawl chart data can provide you with the information you need to run data-driven, revenue-focused experiments. And deliver even clearer ROI-attributable results.
Why is Googlebot crawl data so valuable?
SearchPilot measures your SEO test results using traffic rather than rankings. Why? While some changes you make to variant pages will impact your Search Engine Results Page (SERP) position, some may only change how your site appears on SERPs.
Think about the technical or behind-the-scenes changes you make. Things like Schema Markup, metadata, image alt text, and so on. These may not make you rank higher, but they might impact how your page appears on SERPs. This might be through FAQ-rich results, event listings, or other rich snippets. These changes can influence how much traffic you receive without a change in ranking.
These kinds of changes are incredibly valuable to test as they are likely to impact click-through rate (CTR) (which we analyze using Google Search Console data). After all, it’s all very well being top of a Google search, but if it doesn’t lead to more traffic and conversions, that’s doing nothing for your bottom line.
To understand any change in traffic, however, you need to be sure that Google has crawled the variant pages and delivered those changes to the results pages. And this is why contextualizing traffic data with crawl data is so valuable.
Elevating SEO test insights with Googlebot charts
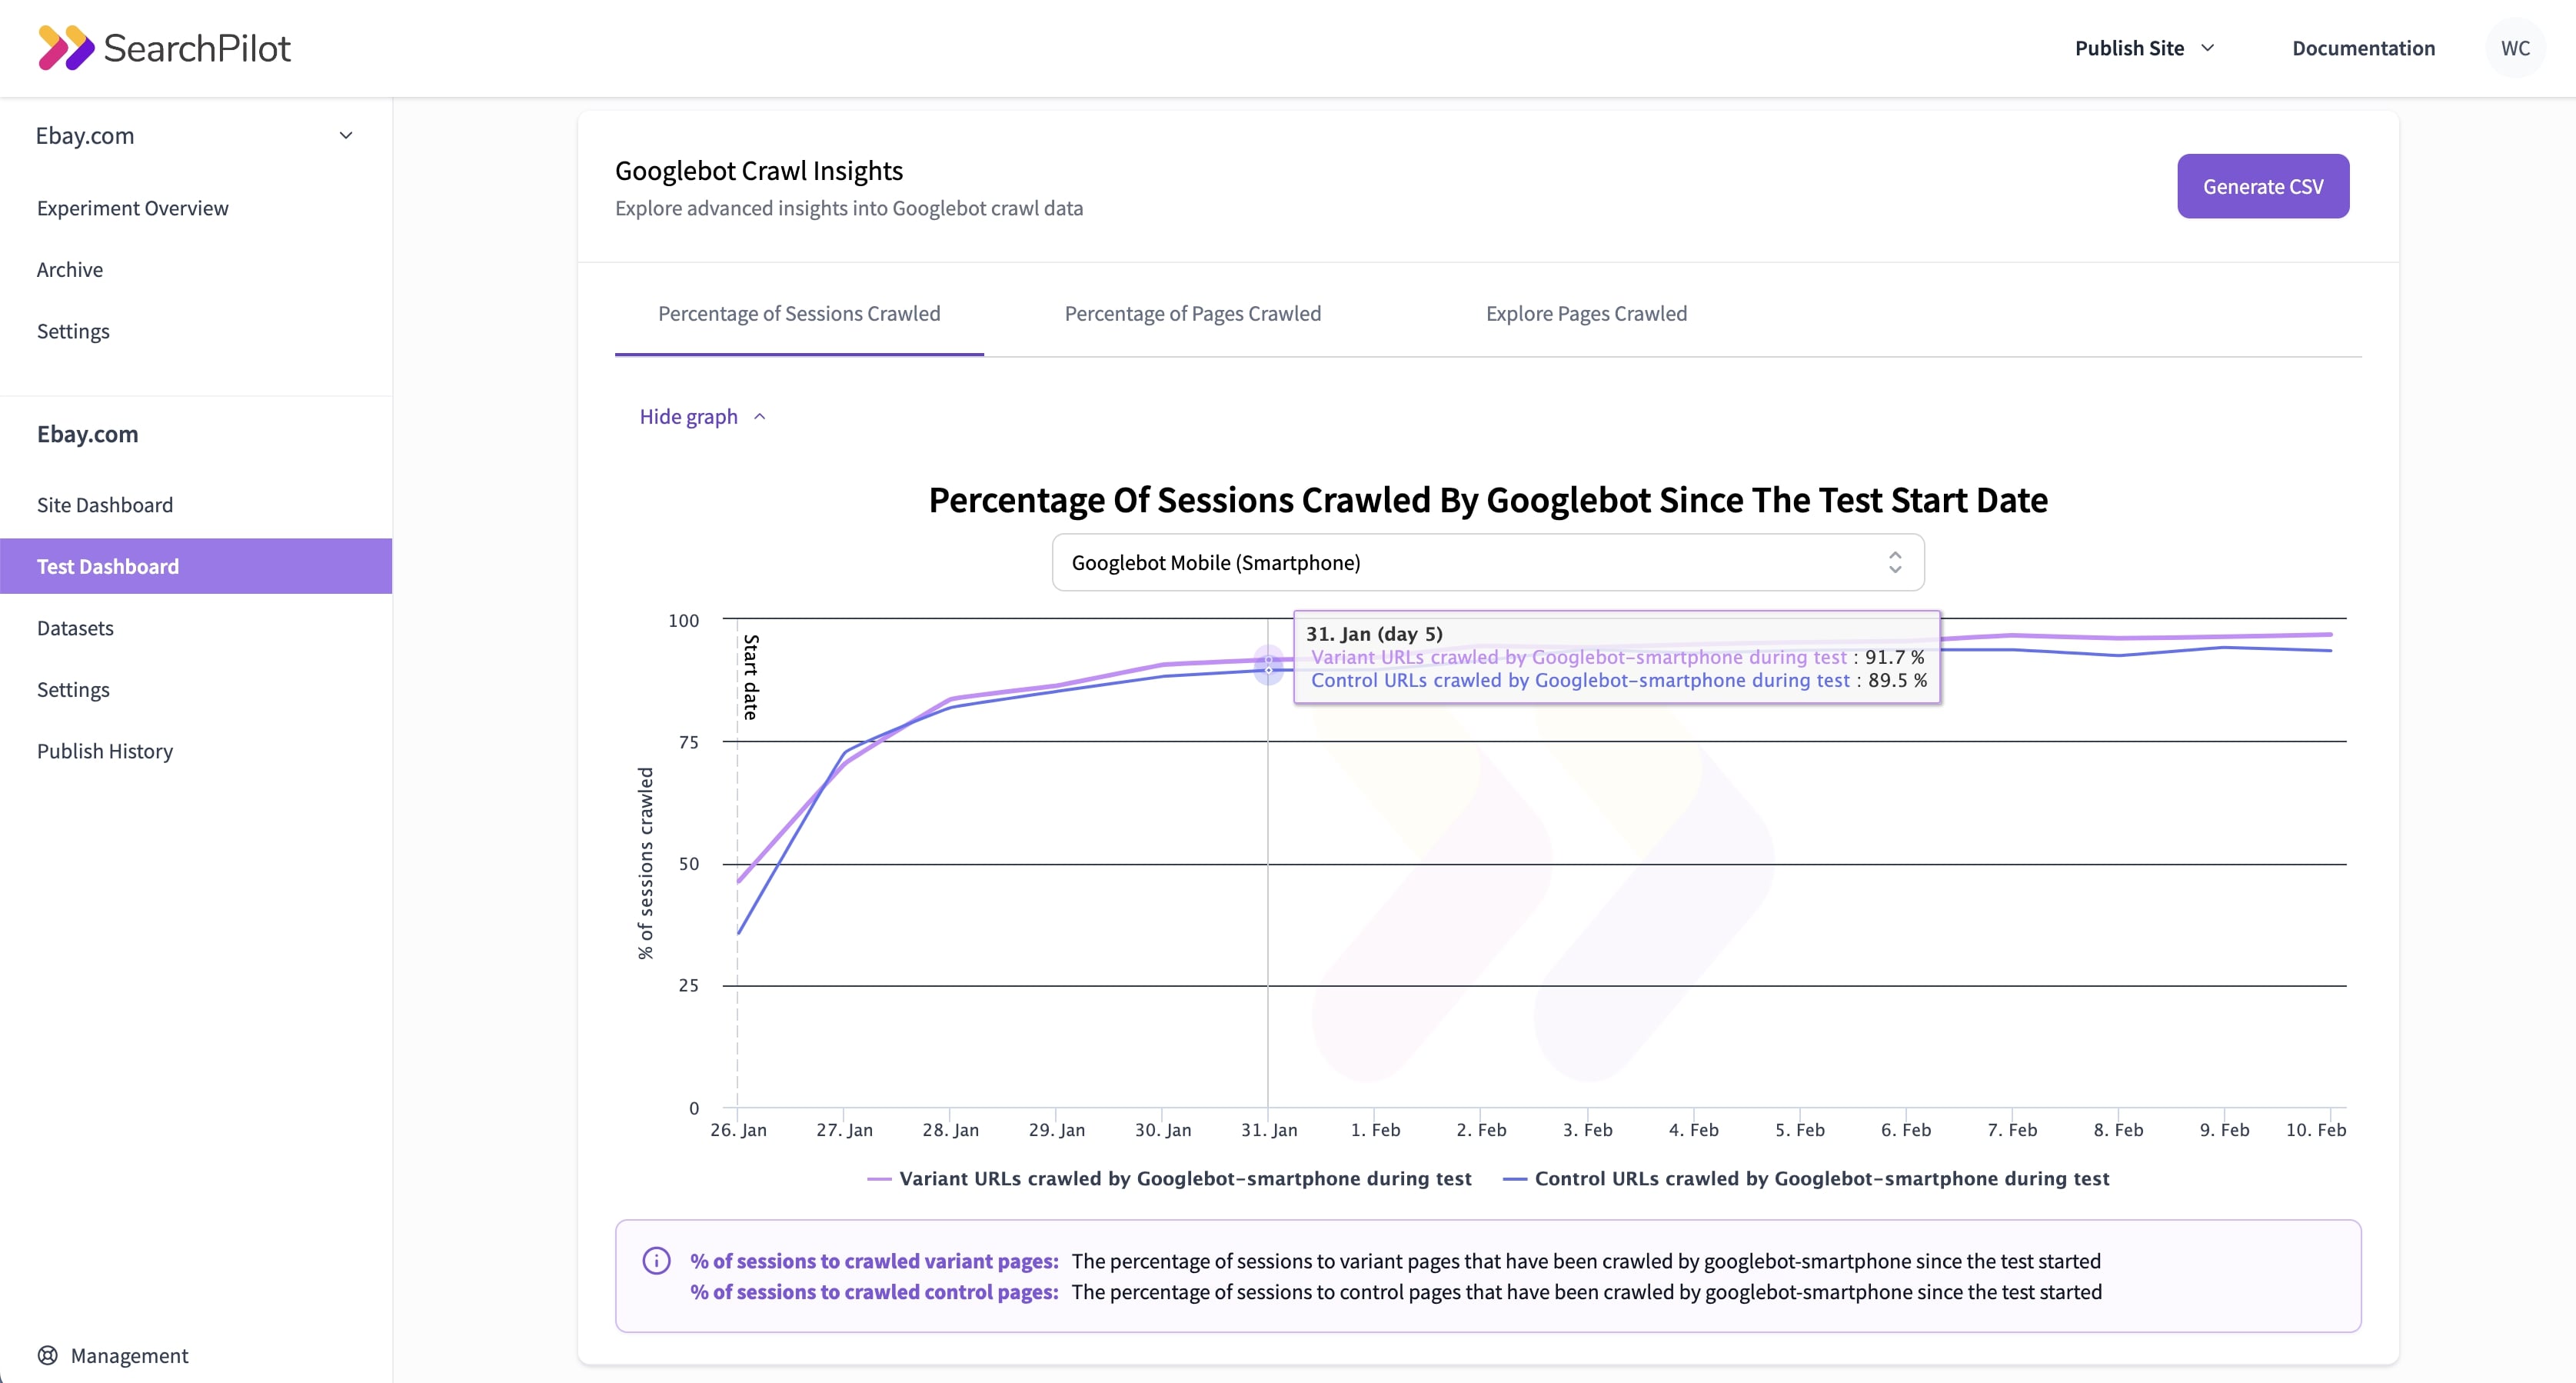
We’ve built a series of practical charts into our test dashboards based on crawl data. We developed them alongside feedback from our customers, and they let you see:
- The raw number of variant pages that have been re-crawled since the start of the test
- Specific pages within the test that have been re-crawled
- The percentage of organic sessions that have visited variant pages since they’ve been re-crawled

Although this is the less intuitive metric, it’s probably the most important one because it is weighted towards the pages driving the lion’s share of the traffic. In turn, it more closely relates to the business benefit.
What can you do with Googlebot Crawl data?
Our neural network model is highly sensitive, which means it can confidently detect even slight changes in traffic. Our platform accounts for a range of factors, including seasonality, competitor activity, and search engine algorithm updates. This delivers highly accurate results for every test.
But not every test has a clear outcome. And even those that do can take a while to reach a high confidence level. And it’s here especially that contextualizing test results with Googlebot’s crawl behavior can offer value. Let's explore the benefits in detail.
Know for sure if Googlebot has re-crawled your test pages
We'll start with the most apparent benefit. We’ll start with the most apparent benefit. You get better visibility of whether Googlebot has re-crawled your test pages, which most SEO teams find useful as a sense-check. Additionally, this data helps you identify whether tests that show no detectable trend may only look that way because they have not have been sufficiently recrawled yet.
You can see the percentage of sessions crawled by Googlebot since the test’s start date. This shows how many users have visited a page after Googlebot re-crawled it. This is an extremely valuable insight, as it shows you that Googlebot has re-crawled your page, that users are seeing the re-crawled page, and is weighted towards the most important pages in the test.
Roll out positive changes faster
With any website, no two pages hold the same value. Even statistically similar pages will receive different organic traffic levels, have varying conversion rates, and sit in different places on SERPs. So, when you test these similar web pages using SearchPilot, it’s not always vital that every single page gets re-crawled.
Let’s say you’re running a test that shows a positive result and a 90% confidence interval. Googlebot crawl data can tell you whether the most important (high traffic and high revenue) pages have been crawled. If they have, you don’t have to wait until the confidence interval is 95% or 100%. You can move forward, roll out the changes, and start a new test.
Make more informed decisions about test duration
This increased visibility means you can make better-informed decisions — not only about your site but also about the SEO tests themselves. Let’s say you’re running an SEO test that looks like it will be inconclusive. You may want to keep the test running for a little longer to see what happens and ensure the test has had time to reach its full potential. But, if you can see that
a) Googlebot has recrawled your most valuable test pages and
b) a majority of users have visited the recrawled pages via SERPs,
then you have all the information you need to end the test and move on.
Since you can only run so many experiments in a year, every test comes with an opportunity cost. Having the data to help you end inconclusive or lower confidence interval tests will help you optimize your SEO testing approach. Run more tests, get results faster, and generate more revenue from your website.
Targeted insights for the engineering team
If you can see that Googlebot isn't recrawling your test pages fast enough, you may be able to identify crawlability issues and make vital changes. You can use the same data to spot patterns between pages that have been re-crawled and pages that haven't, as well as any notable discrepancies between the control and variant groups.
See a clear ROI from your SEO efforts
Whether your hypothesis is a success, a failure, or inconclusive, Googlebot crawl chart data adds a whole new layer to your existing data. This means more context and even more confidence to fuel your experimentation program. You can run more tests more efficiently and get insights faster. And for the business, this means more ROI-attributable results and more website revenue.
Discover how SearchPilot can help you deploy an ROI-driven SEO experimentation program that delivers at speed. Speak to a member of the team today.


